|
One of the more controversial debates entering this season was about which fantasy
quarterback was the best. Michael Vick's injury took him out of the race early,
leaving Daunte Culpepper and Donovan McNabb as the top choices (although in some
pass heavy leagues, Rich Gannon was a strong contender as well). What was the
biggest difference between Culpepper and McNabb, or even Gannon? Interception
rates-specifically, Culpepper had a very high one, and McNabb (and Gannon) had
a very low one. Let's take a look:
In 551 attempts last year, Daunte Culpepper turned the ball over 23 times;
or he threw 4.2 interceptions for every 100 passes, second worst in the NFL.
(Tommy Maddox)
In 361 attempts last year, Donovan McNabb turned the ball over six times; or
he threw 1.7 interceptions for every 100 passes, fourth best in the NFL.
In 616 attempts last year, Rich Gannon turned the ball over ten times; or he
threw 1.6 interceptions for every 100 passes, third best in the NFL. (Chad
Pennington, Brad Johnson)
We all know that Culpepper has been a fantasy stud, and McNabb and Gannon have
been huge busts this year. In fact, Culpepper currently ranks third in points
per game, which includes the partial game he missed against the Lions. McNabb
and Gannon? Neither rank in the top thirty.
However, did you know that Culpepper's strong start includes something special-or
perhaps more precisely, nothing special. In ninety-five attempts, the Vikings
star has yet to turn the ball over. He's the only QB in the league that has
yet to be intercepted. McNabb has equaled his six picks of a season ago, and
ranks in the middle of the league in interceptions per attempt (3.2). Rich Gannon,
despite not producing much for his fantasy owners, at least hasn't killed his
team with mistakes-he has the fourth best INT rate in the league, throwing just
1.8 interceptions for every 100 attempts.
Remember when Chad Pennington came in for the Jets last season, and seemed
to be the polar opposite of Vinny Testaverde? Pennington led the league in QB
rating and completion percentage, while finishing second in INT percentage.
Testaverde has earned the moniker "Intercerptaverde", throwing for
233 interceptions in his career. However, he has the third best rate
in the league this year with just two interceptions, behind Culpepper and Steve
McNair.
Some players have interception rates that seem to fluctuate often-like Peyton
Manning. In 1998, he threw 4.9 INTs per 100 passes as a rookie; that number
dropped to 2.8 and 2.6 the following years, but in 2001 it shot up to 4.2.
Common sense indicates that some quarterbacks are interception prone (i.e.,
they are risky with the ball year after year), while some do a great job holding
onto the ball (i.e., they consistently avoid turnovers). However, some of these
examples seem to dictate otherwise-are these isolated examples? Do some quarterbacks
get better and worse at holding on to the ball? How consistent are interception
rates from year to year? These are some of the questions that were on my mind.
I looked at every quarterback for a five year span, from 1997-2001. I then
eliminated any quarterback who failed to throw at least 224 passes (the NFL
requires a quarterback throw at least fourteen passes per game to qualify for
the QB rating title) in either the current (Year N), or the following season
(Year N+1). I was left with 108 seasons, and I calculated the interception rate
for all quarterbacks during that span. Remember, Interception rate is defined
as interceptions divided by pass attempts, multiplied by 100. The columns "Year
N", and "Year N+1", represent the average scores of the quarterbacks
in that group. "Change" is whether they got better or worse at avoiding
interceptions.
Here are the results.
|
Grp
|
INT Rt
|
#ofQBs
|
Yr N
|
Yr N+1
|
Change
|
|
1
|
>5.00
|
4
|
5.52
|
4.08
|
+1.44
|
|
2
|
4.00-4.99
|
15
|
4.37
|
3.50
|
+0.87
|
|
3
|
3.00-3.99
|
33
|
3.45
|
3.22
|
+0.23
|
|
4
|
2.00-2.99
|
44
|
2.57
|
3.03
|
-0.46
|
|
5
|
1.00-1.99
|
12
|
1.60
|
2.56
|
-0.96
|
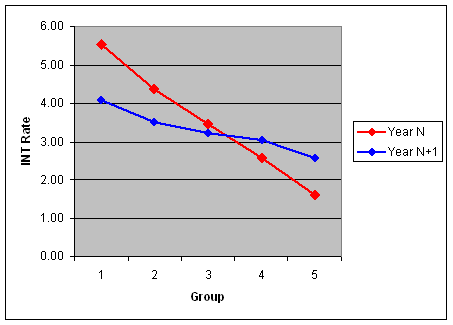
It's quite clear that there's a correlation between interception rates in one
year, and interception rates in the following season. Equally clear however,
is that there's a strong regression to the mean: the quarterbacks that
threw a lot of interceptions in the first year improved quite a bit the following
season. Likewise, the quarterbacks that held onto the ball especially well in
any given season weren't as proficient the next time around. This graph helps
to illustrate that:
For those of you who enjoy correlation coefficients, the correlation between
the INT Rates of the 108 QBs in year N to year N+1 was 0.32. As with our other
metrics, this tells us the same thing:
The ability to throw (or avoid) interceptions does appear to be a skill,
and holds some degree of consistency from year to year. However, in general
knowing how often a quarterback turns the ball over in the past is not a strong
indicator of how much he'll turn it over in the future.
Is this common among statistics? How would the TD rate compare to the INT rate
for these same 108 QBs. The same conditions used above apply:
|
Grp
|
TD Rt
|
#ofQBs
|
Yr N
|
Yr N+1
|
Change
|
|
1
|
>6.00
|
9
|
6.83
|
4.78
|
-2.05
|
|
2
|
5.00-5.99
|
18
|
5.45
|
4.57
|
-0.88
|
|
3
|
4.00-4.99
|
27
|
4.55
|
4.13
|
-0.42
|
|
4
|
3.00-3.99
|
37
|
3.51
|
3.90
|
+0.39
|
|
5
|
<3.00
|
17
|
2.54
|
3.64
|
+1.10
|
It's not a big surprise to see the same general trend that was evident with
the interception chart. Those that performed spectacularly (or terribly) in
one year came back down (or up?) to earth the following season. Here's the graph:
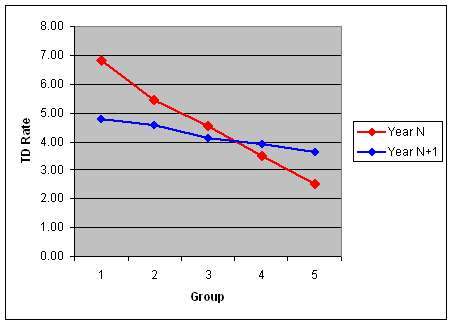
The line gets much less steep the following year, which usually indicates more
luck than skill contributes to those exceptional performances-they don't lend
themselves toward repetition. What's also interesting is the correlation coefficient
of the 108 QBs, from year N to year N+1-0.30. Recall that the correlation of
the INT rates was also low, at 0.32. While the difference between those two
metrics is neglible, a great deal of insight can be drawn
Just as interception rates tend to be difficult to predict from year to
year, touchdown rates are equally puzzling. Knowing how well a group of QBs
throw touchdowns in the past doesn't tell us a whole lot about how they will
do in the future. The quarterbacks who averaged over two more touchdowns per
100 throws (5.45 to 3.41) averaged just 0.67 more TDs the following year (4.57
to 3.90). Even the passers that averaged 4.29 more scores per 100 throws (group
one to group five), beat their counterparts by only 1.14 the next season.
For those interested, the highest touchdown rate was recorded by Kurt Warner
in 1999, at 8.23. Daunte Culpepper (7.36) and Jake Plummer (6.10) currently
lead their respective conferences. Just one quarterback in the study failed
to average two touchdowns per 100 attempts-Tony Banks in 1997. Interestingly
enough, he averaged 5.32 the following season, following by 2.92 in 1999.
What's with these Philly QBs? Bobby Hoying threw 225 passes in 1998, but failed
to throw a single touchdown. (Note: He wasn't included in the study because
he didn't throw 224 passes the following season). The Eagles drafted McNabb
the next April, but he's off to the worst start of any QB in the league: His
1.05 touchdown rate is just another example of how rough a season it's been
for the former Orangeman.
Results?
It's always a surprise when you see a player turn things around so dramatically
in one season. For the next ten games, is Daunte Culpepper more likely to be
the interception prone QB of 2002, or the error-free version so far this year?
What about a player such as Tommy Maddox, who has seen his TD rate drop from
5.3 to 2.4? It would be pure speculation to tell you how either of those players
will do in 2003, but I can write this-putting a label on a player rarely works.
Theories based on drafting this player because "he throws touchdowns",
and avoiding someone because "they can't figure out who is on their team"
don't hold much water under the analysis presented here.
One final note: Don't take this to be the end-all on interception and touchdown
rates from year to year. Questions such as why does this happen, is this predictable
for specific QBs, and are there ways of further dividing groups of players to
help us better understand this wacky game are outside the scope of this article.
Doug Drinen has also done some work on this, and about halfway down the page
you'll see he found some similar results, although he worked through the problem
using raw numbers (interceptions and touchdowns).
http://www.pro-football-reference.com/articles/defcc.htm
Please direct all questions and comments to [email protected]
|